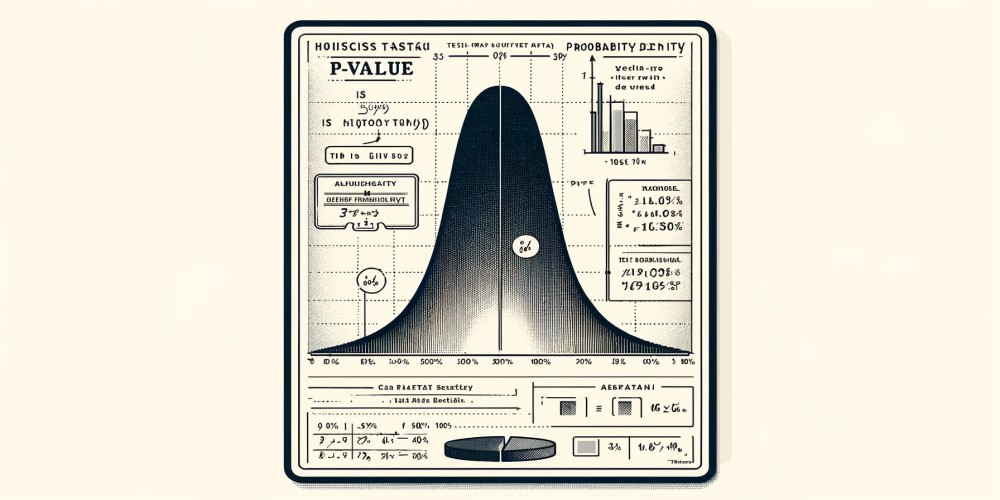
In statistics, the p-value is a measure used to determine the strength of evidence against a null hypothesis. It represents the probability of observing the data, or more extreme data, given that the null hypothesis is true. In other words, the p-value indicates the likelihood of obtaining the observed results if the null hypothesis (typically stating no effect or no difference) is correct.
A common threshold for interpreting p-values is 0.05. If the p-value is less than 0.05, it is often considered statistically significant, suggesting that the observed results are unlikely to have occurred by chance alone, and the null hypothesis may be rejected. Conversely, if the p-value is greater than 0.05, the results are not considered statistically significant, and the null hypothesis is not rejected. These interpretations assume that the null hypothesis is stating no effect or no difference
However, it’s essential to recognize that the p-value is not a measure of the size or importance of an effect, nor does it provide information about the probability that the null hypothesis is true or false. Additionally, misinterpretation or misuse of p-values can lead to several common mistakes and misunderstandings:
- Confusing statistical significance with practical significance: A statistically significant result does not necessarily mean that the observed effect is large or meaningful in real-world terms. Conversely, a non-significant result does not imply the absence of an effect. Researchers should consider effect sizes and practical implications in addition to p-values.
- Treating p < 0.05 as a categorical threshold: Using a p-value cutoff of 0.05 as a strict rule for decision-making can lead to arbitrary conclusions. It’s important to consider the context of the study, the specific research question, and the consequences of Type I and Type II errors when interpreting p-values.
- Multiple comparisons and p-value inflation: Conducting multiple statistical tests increases the likelihood of obtaining significant results by chance alone (known as Type I error inflation). Researchers should adjust for multiple comparisons using methods such as Bonferroni correction to maintain appropriate control over the overall false positive rate.
- Ignoring study design and assumptions: The validity of p-values depends on the assumptions underlying the statistical tests and the quality of the study design. Violations of assumptions (e.g., non-normality, heteroscedasticity) or biases in study design can undermine the reliability of p-values.
- Publication bias and selective reporting: Studies with statistically significant results are more likely to be published, leading to publication bias and an overrepresentation of significant findings in the literature. Researchers should be cautious of selective reporting and consider publication bias when interpreting p-values.
In summary, while p-values can provide valuable information about the evidence against a null hypothesis, they should be interpreted and used with caution, considering effect sizes, study design, and potential sources of bias. Collaborating with statisticians and adhering to best practices in statistical analysis can help mitigate common mistakes and promote sound interpretation of p-values in research.
